XRP Charts Indicate Bullish Surge: $20 Target by 2025!


XRP Price Surge: Analysts Predict Potential for Further Gains
XRP Reaches New Heights with Promising Technical Indicators
XRP has recently achieved a remarkable milestone, soaring to a multiyear peak of $3.66, marking a nearly 90% increase since its lows in April. Despite this impressive rally, analysts believe that the cryptocurrency may still be on the verge of a significant upward trajectory.
XRP Dominance Indicates a Potential Bullish Wave
Crypto analyst Dom highlighted that while XRP has reached new highs, several indicators suggest that the market has not fully transitioned into a bullish phase. One key metric is the XRP dominance (XRP.D) chart, which has encountered resistance at approximately 5.50%, a level that has held firm for over 2,200 days.
Dom noted, “Historically, when XRP.D has broken through this resistance, it has often led to a doubling of value shortly thereafter.” He speculated that if this pattern holds true, XRP could target a price range between $7 and $10, contingent on broader market movements.
Fellow analyst Egrag Crypto echoed this sentiment, asserting that the XRP dominance chart is signaling a significant bullish trend. He pointed out that the metric has recently broken out of a bull pennant formation, suggesting a potential dominance range of 21% to 275%. Egrag emphasized that a closure above 5.75% could trigger a substantial upward movement for XRP dominance.
XRP/BTC Chart Suggests Potential for Explosive Growth
In addition to its performance against the US dollar, XRP is showing bullish trends in relation to Bitcoin (BTC). The XRP/BTC pair is poised to break through a crucial resistance zone that has constrained its price since mid-2019. Analysts believe that clearing this level could lead to a significant price surge, reminiscent of the explosive growth seen in 2018.
Dom explained that this resistance zone has been a barrier for XRP for over 2,200 days, rejecting the price multiple times. He noted, “Whenever this level has been reclaimed in the past, it has resulted in a substantial upward move.”
Furthermore, an anticipated bullish crossover in the moving average convergence divergence (MACD) indicator supports the notion that XRP could experience significant gains once confirmed. Previous bullish crossovers in March 2021 and November 2024 resulted in remarkable increases of 514% and 400%, respectively, for the XRP/BTC pair.
Monthly Chart Indicates Target of $20 for XRP
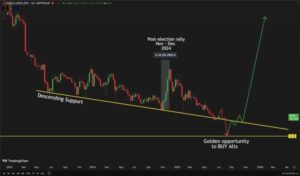
On the monthly chart, XRP is validating a bull pennant pattern, facing resistance at its all-time high of $3.84. A bull pennant typically forms after a notable price increase, followed by a consolidation phase at elevated levels.
A monthly close above the upper trendline of the pennant at $2.55 would pave the way for XRP to aim for a target exceeding $18, representing a potential increase of 417% from its current price. Trader XRPunkie remarked, “Based on straightforward technical analysis, a target of $20 or more for XRP seems inevitable by the end of this cycle.”
This article serves as an informational piece and does not constitute investment advice. Readers are encouraged to conduct their own research before making any financial decisions.