Ethereum Dips from 5-Month High: What This Means for Investors


ethereum Approaches Five-Month Peak Amid Market Fluctuations
Bullish Outlook for ethereum
ethereum has surged to a price of $3082.83, a level not seen since February, although it experienced a slight pullback on Tuesday. The daily chart indicates that the low from July 12, recorded at $2905.98, continues to provide support, keeping the short-term upward trend alive. Should ethereum break above the $3082.83 mark, it could target the lows from December 2024 and January 2025, ranging from $3099.60 to $3127.83. The next significant resistance level would be the low from January 9, which stands at $3157.76.
Bearish Perspective on ethereum
Despite its recent gains, ethereum remains under the July high of $3082.83. A decline below the July 12 low of $2905.98 could lead to a revisit of the June peak at $2879.45. Further down, the critical support zone between $2788.12 and $2502.62 is anticipated to withstand any downward pressure, bolstered by the accelerated uptrend line from June to July, currently at $2706.85. If this support fails, the 55-day simple moving average (SMA) at $2586.04 may come into play.
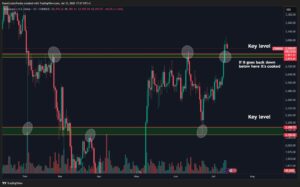
ethereum/USD Price Chart Analysis
This analysis provides a comprehensive overview of ethereum‘s current market position, highlighting both potential upward and downward movements. Investors should remain vigilant as the cryptocurrency navigates these critical price levels.