Ethereum Surges 2.80% to $2502.76: What This Means for Investors

ethereum Price Update: Significant Gains and Market Trends
ethereum Sees Notable Increase
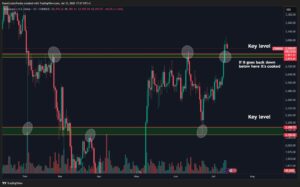
ethereum has experienced a rise of $68.11 today, marking a 2.80% increase, bringing its current value to $2502.76.
Highest Closing Level Since June 2025
This price point represents the highest closing level since June 19, 2025, when ethereum was valued at $2507.19.
Largest Percentage Surge in Recent Weeks
The cryptocurrency has also recorded its most substantial percentage increase since June 24, 2025, when it rose by 4.48%.
Recent Performance Highlights
Positive Momentum Over the Past Week
In the last five days, ethereum has shown positive momentum, gaining ground on four occasions. Notably, it has risen for three consecutive days, accumulating a total increase of 3.16% during this period.
Monthly and Yearly Trends
Despite the recent gains, ethereum is down 1.58% for the month, indicating it may face its most challenging month since March 2025, when it fell by 18.10%. Year-to-date, the cryptocurrency has decreased by 25.17%.
Historical Context
ethereum‘s current price reflects a significant decline of 48.56% from its all-time intraday high of $4865.81, reached on November 10, 2021. Additionally, it is down 27.73% compared to the price from a year ago (July 1, 2024), when it was trading at $3462.83. From its 52-week intraday peak of $4105.92 on December 16, 2024, ethereum has dropped by 39.05%. However, it has rebounded by 74.34% from its 52-week intraday low of $1387.85, recorded on April 9, 2025.
Intraday Trading Insights
Recent Trading Activity
During today’s trading session, ethereum reached an intraday high of $2523.77, marking the highest level since June 20, 2025. At this peak, the cryptocurrency was up by 3.66%.
Conclusion
This update reflects the current state of ethereum‘s market performance, showcasing both its recent gains and ongoing challenges. The data presented here is based on a snapshot taken at 5 p.m. ET from Kraken and compiled by Dow Jones Market Data.
Note: All figures and data are subject to market fluctuations and should be verified with official sources.


